

HARRY'S BI-WEEKLY UPDATE 8.4.2022
August 4, 2022
HARRY’S BI-WEEKLY UPDATE
A Current Look at the Colorado Springs Residential real estate Market
As part of my Personal Service, it is my desire to share current real estate issues that will help to make you a more successful and profitable buyer or seller.

I COULDN’T HAVE STATED IT BETTER…
It’s a “new day” in Residential real estate...it’s been brewing for some time now…and while we are not seeing changes quite like a lot of the USA, the current recession is hitting our market somewhat as well.
The higher mortgage rates, while still on the low side, are especially affecting first-time buyers and those who might not qualify as easily in today’s market.
As you will see in the statistics below, our listings are slightly down and there are now considerably more homes for sale than in the most recent past. However, on the bright side, our average sales price on single-family/patio homes is up 11.2% and on Condo/Townhomes it is up 15.2%. The median sales prices on those transactions continue to rise as well.
I’ve been saying for some time now that price increases need to normalize and they are finally beginning to do so, although slowly. I predicted an annual price appreciation of 10-12% for 2022, and we look to be on target for that. And let’s not forget---that 10-12% is considerably higher than the returns we are seeing in stocks, bonds, and most other investments.
Our total active listings are way up, both year-over-year as well as month-over-month. Again, a function of Econ 101—supply and demand. Price appreciation was not going to normalize until there were more homes for sale, and we are now starting to see an increase in inventory.
Homes are still selling briskly, but rarely in one day and not nearly as many offers as in recent times. This is most definitely good for potential buyers, as the frenzy of the last few years has settled down a little bit. Of course, sellers are also in a good place since home prices have not been affected very much.
real estate economists are not predicting a “housing bubble” like what occurred in 2008, and an article below helps explain that.
All of that said, it’s still a great time to buy and/or sell if that’s what you are considering. There are many ways to make that happen, and fortunately for you, you’ve got me, and I have has seen all housing cycles imaginable.
And speaking of me, I celebrated 50th years in the local residential real estate arena in April. That, combined with my Investment Banking background, gives me a heads up on understanding all types of scenarios and I am thrilled to put that experience to work for my clients.
It all starts with a call to 719.593.1000 or email to Harry@HarrySalzman.com and we can begin work to make your housing dreams come true.
And now for statistics…
JULY 2022
Statistics provided by the Pikes Peak REALTORS Service Corp., or it’s PPMLS
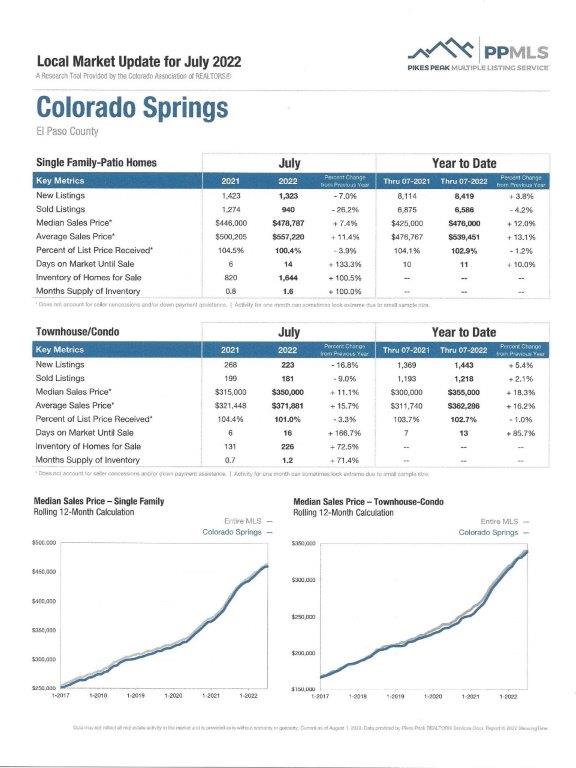
Here are some highlights from the July 2022 PPAR report.
In El Paso County, the average days on the market for single family/patio homes was 13. For condo/townhomes it was 14.
Also in El Paso County, the sales price/list price for single family/patio homes was 100.3% and for condo/townhomes it was 100.8%.
In Teller County, the average days on the market for single family/patio homes was 19 and the sales/list price was 99.4%.
Please click here to view the detailed 10-page report, including charts. If you have any questions about the report or to find out how it relates to your individual situation, just give me a call.
In comparing July 2022 to July 2021 for All Homes in PPAR:
Single Family/Patio Homes:
· New Listings were 2,087, Down 4.1%
· Number of Sales were 1,403, Down 23.9%
· Average Sales Price was $557,250, Up 11.2%
· Median Sales Price was $482,500, Up 7.2%
· Total Active Listings are 2551, Up 160.0%
· Months Supply is 1.8, Down 6.7%
Condo/Townhomes:
· New Listings were 270, Down 14.8%
· Number of Sales were 208, Down 13.7%
· Average Sales Price was $374,320 Up 15.2%
· Median Sales Price was $352,500, Up 11.9%
· Total Active Listings are 234, Up 125.0%
· Months Supply is 1.1, Down 9.1%
Now a look at more statistics…
JULY 2022 MONTHLY INDICATORS AND LOCAL MARKET UPDATE ILLUSTRATE OUR LOCAL TRENDS IN DETAIL
Colorado Association of REALTORS® , Pikes Peak REALTORS Service Corp, or it’s PPMLS
Providing greater detail than the above report, this contains information on both El Paso and Teller counties for Residential real estate.
The “Activity Snapshot” for all residential properties in El Paso and Teller counties shows the Year to Date one-year change:
- Sold Listings for All Properties were Down 23.0%
- Median Sales Price for All Properties was Up 8.0%
- Active Listings on All Properties were Up 91.8%
You can click here to read the 16-page Monthly Indicators or click here to get specific information on the geographical are of your choice from the 18-page Local Market Update. It’s a good idea to check out your own area or one that you might be considering to get a good idea of the local pulse. As an example, here is a detailed report on the Colorado Springs area:
THE CURRENT RESIDENTIAL real estate MARKET IS NOT A HOUSING BUBBLE
KeepingCurrentMatters, 8.2.22
As the housing market shifts, some of you may be wondering what will happen next. Some consumers believe the market is in a housing bubble, and it’s only natural for concerns to turn to whether it could be a repeat of what took place in 2008.The good news is, there is a lot of concrete data to show why this is nothing like last time.
There’s a Shortage of Homes on the Market Today, Not a Surplus. The supply of inventory required to sustain a normal real estate market is approximately six months. Anything more is an overabundance and will cause prices to depreciate. Anything less is a shortage and will lead to continued price appreciation.
For historical context, there were too many homes for sale during the housing crisis (many of which were short sales and foreclosures), and that caused prices to fall. Today, supply is growing but there is still a shortage of available inventory, and most especially here in the Colorado Springs area.
The graph below uses data from the National Association of Realtors (NAR) to show how this time compares to the crash. Today nationally, unsold inventory sits at just a 3.0-months’ supply at the current sales pace.
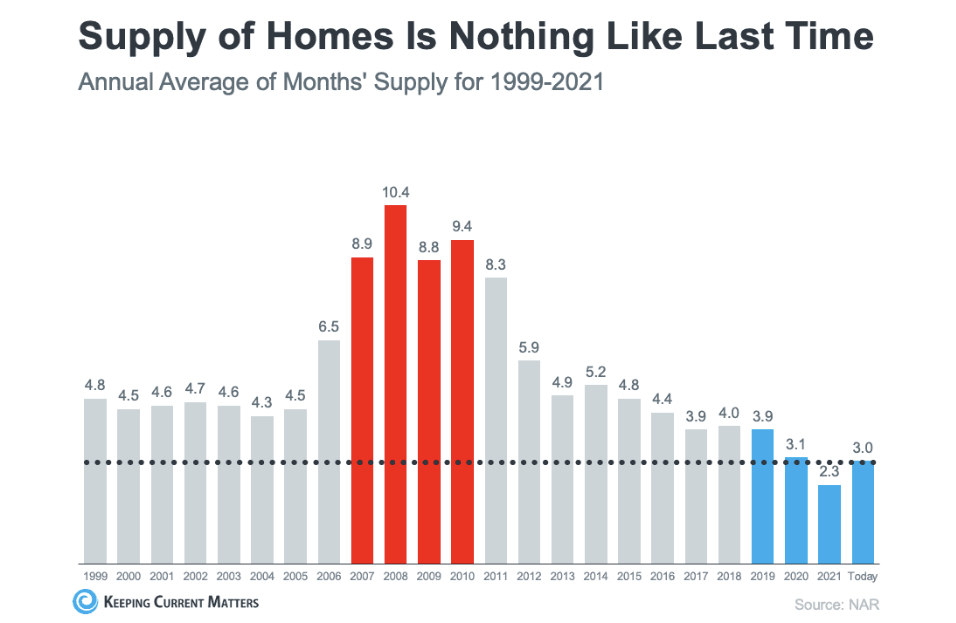
Among the reasons inventory is still low is because of sustained underbuilding. When you couple that with ongoing buyer demand as millennials age into their peak homebuying years, it continues to put forward pressure on home prices. That limited supply compared to demand is why experts forecast home prices won’t fall this time.
Mortgage Standards Were Much More Relaxed During the Crash. It was much easier to get a home loan during the lead-up to the housing crisis than it is today.
The graph below showcases data on the Mortgage Credit Availability Index (MCAI) from the Mortgage Bankers Association (MBA). The higher the number, the easier it is to obtain a mortgage.
.jpg)
Running up to 2006, banks were creating artificial demand by lowering lending standards and making it easy for just about anyone to qualify for a home loan or refinance their current home. Back then, lending institutions took on much greater risk in both the person and the mortgage products offered. That led to mass defaults, foreclosures, and falling prices.
Today things are quite different, and buyers are facing much higher standards from mortgage lenders. Mark Fleming, Chief Economist at First American, says: “Credit standards tightened in recent months due to increasing economic uncertainty and monetary policy tightening.”
The stricter standards of today help prevent the risk of a rash of foreclosures like there was last time.
The Foreclosure Volume Is Nothing Like It Was During the Crash. The most obvious difference is the number of homeowners that were facing foreclosure after the housing bubble burst. Foreclosure activity has been on a downward trend since the crash because buyers today are more qualified and less likely to default on their loans.
The graph below uses data from ATTOM Data Solutions to help explain:
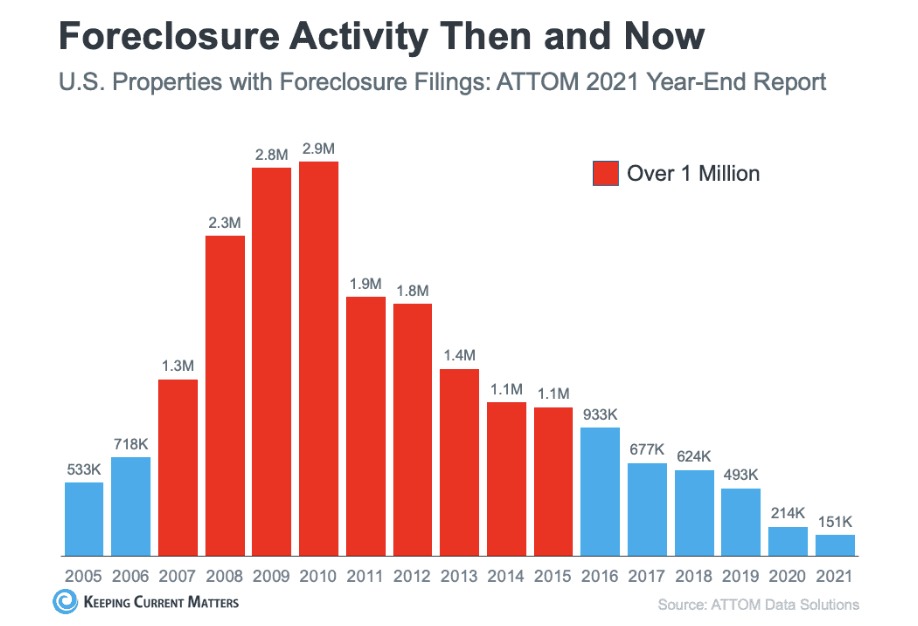
Important to note is that homeowners today are equity rich, not tapped out. In the run-up to the housing bubble, some homeowners were using their homes as personal ATMs. Many withdrew equity as it built up. When home values began to fall, some found themselves in a negative equity situation where the amount they owed on their mortgage was greater than the value of their home. Some of those homeowners decided to walk away from their homes, and that led to a wave of depressed property listings (short sales and foreclosures), which sold at considerable discounts that lowered the value of other properties in the area.
Today, prices have risen nicely over the last few years and that has given homeowners an equity boost. According to Black Knight: “In total, mortgage holders gained $2.8 trillion in tappable equity over the past 12 months—a 34% increase that equates to more than $207,000 in equity available per borrower…”.
With the average home equity now standing at $207,000, homeowners are in a completely different position this time.
Bottom Line? If you’re concerned about today being anything like the housing bubble of 2008, these graphs should help alleviate your worries. Concrete data and expert insights clearly show why today is nothing like the last time.
If you have any questions about any of this, please give me a call.
UCCS ECONOMIC FORUM UPDATE
College of Business, UCCS, updated 7.29.22
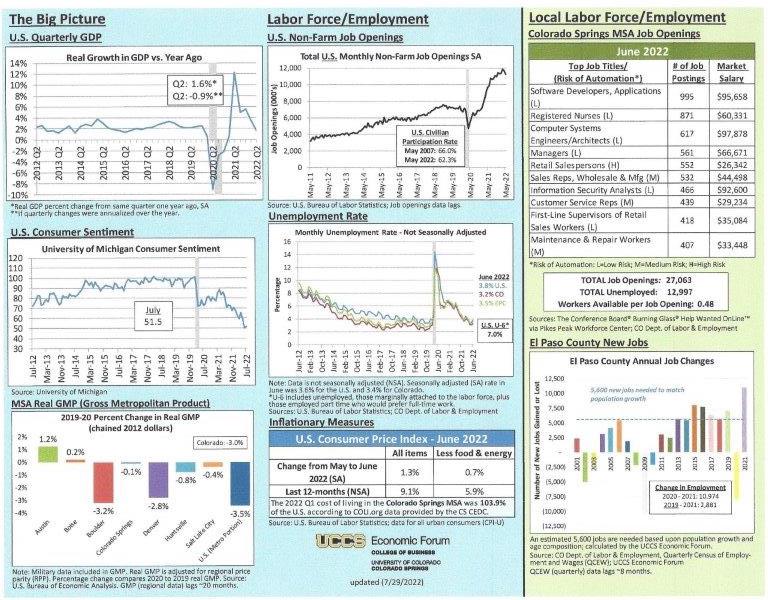
Here is the most recent economic update from the UCCS Economic Forum. It provides data concerning all aspects of the economy, on both the national and Colorado Springs area levels.
I’ve reproduced the first page of the graphs and you can click here to see the report in its entirety. If you have any questions, please give me a call.
For those of you who like to plan ahead, the always informative UCCS Economic Forum Event this year will be held at the ENT Center for the Arts on Thursday, September 1, 2022, from 1:30-4:30, with a networking and happy hour to follow. Full agenda and registration can be found at: